The biggest challenge most businesses face isn’t related to traffic generation, rather it is about converting visitors into customers. The first barrier, of course, is to drive traffic, but that’s not the end. You’ll notice that once your site starts receiving traffic, you’ll struggle with conversions and conversion rate optimization.
And that’s when you’ll realize the importance of A/B testing.
This guide covers everything you need to know about A/B tests, their importance, how to get started, and common mistakes you should avoid.
What is A/B Testing?
A/B test or split test is an experimentation technique used in marketing where you compare two versions of a web page to identify a winner. The versions are known as A and B which are shown randomly to people who visit a page you are testing.

You can use the A/B test to compare two versions of a landing page, email subject line, design, email content, mobile app, ad, images, and much more. It is used in conversion rate optimization (CRO) and helps you make data-based decisions to choose the best performing version that converts at a much higher rate than the other version.
Why Are A/B Tests Important for Your Business?
Split testing offers a wide range of benefits to your business and is the backbone of conversion optimization. It directly impacts the bottom line of your company and this is what makes it important.
Here’s a breakdown of why A/B testing is critical for your business:
Better Audience Understanding
A/B tests provide you insights about what your ideal customers want to see and what type of elements they engage with the most. You can use this data to update buyer personas that will help you improve marketing effectiveness.
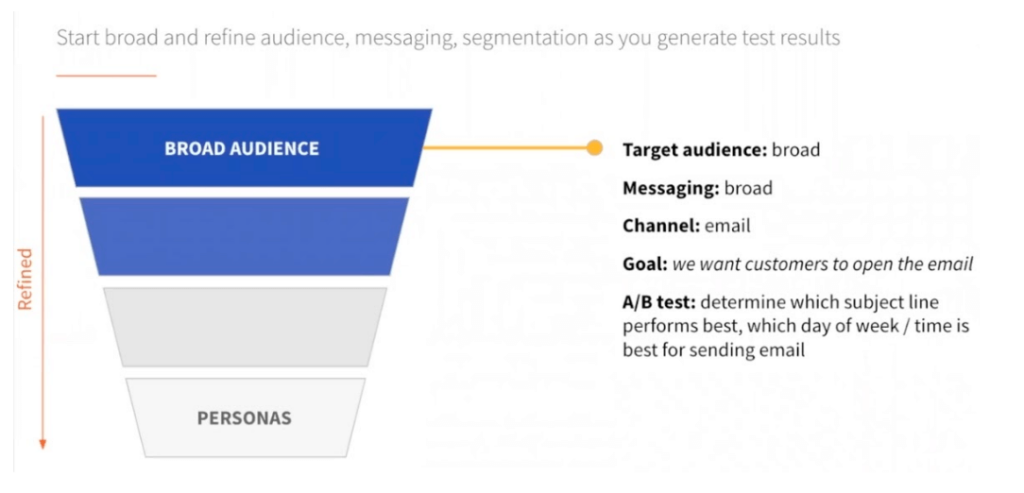
The more experiments you run, the easier it gets to refine buyer personas.
Improves Conversion Rate
The primary purpose of running an A/B test is to improve conversion rate. A high conversion rate means a successful business model where you convert a decent percentage of visitors into customers.
You can spend heaps of money on marketing campaigns but if you have a low conversion rate, it won’t move the needle. But if you have a high conversion rate, you can do wonders with minimal traffic or even with a significantly low marketing budget.
Here’s an example of how you can use the A/B test to avoid funnel leakages and increase conversions without spending any additional money on marketing:

You can avoid leakages throughout the sales funnel by running A/B tests and figuring out what makes visitors leave your funnel. Fix it and you can significantly increase conversions.
Cost-Effective Way to Improve Marketing Effectiveness
Imagine you spend $5,000 per month to drive 10,000 visitors to your landing page which converts at 2%. It means you generate 200 conversions or sales for every $5K spent on marketing.
This is without A/B tests.
Now, you spend $500 per month on A/B experimentation which increases your conversion rate from 2% to 3%, here’s what the new numbers will look like:
Monthly marketing spend: $5,000
Visitors per month: 10,000
Conversion rate: 3%
Total conversions: 300
That’s 100 more conversions with the same marketing budget and traffic.
The good part is that A/B testing is quite cost-effective. You can run multiple A/B tests with a paid platform that usually costs less than $500 per month.
Helps Identify Strengths and Weaknesses
A positive side of A/B testing is generalizability. Once you identify what your ideal customers like and what they don’t by running an experiment, you can implement it across your website.
For example, A/B testing CTA button color on a landing page reveals that green outperforms red by a high margin. You can use this data to change the button color of all the CTAs across all landing pages throughout your website.
A/B tests are a perfect way to find the strengths and weaknesses of your marketing collateral. You can use this data to replicate marketing campaigns at scale.
Helps in Data-Driven Decision-Making
Experimentation takes the guesswork out of the equation. A/B test is a data-driven approach to making the right business and marketing decisions.
The process involves developing hypotheses based on rationale and then scientifically testing your hypothesis. Since you don’t use your gut feeling or judgment to identify a winning variation, this makes A/B testing a scientific approach that you can rely on for decision-making.
A/B Testing Process
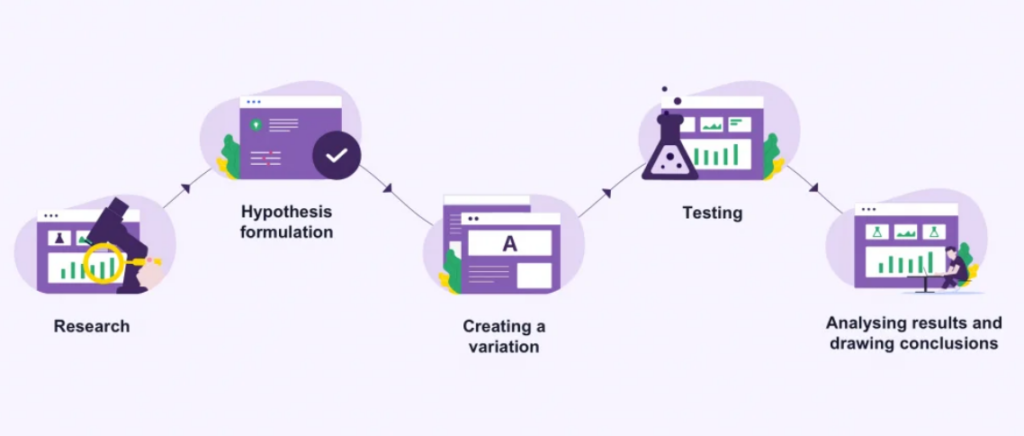
Here’s a 5-step A/B experimentation process that you should follow to create and run a test successfully:
Step #1: Research
The first step is analyzing data to understand website performance and find areas of improvement. Your analytics tool is the primary source of data such as Google Analytics.
There are two approaches to data analysis for A/B testing:
- You identify a problem through analytics or other source of data such as a page with a poor conversion rate but high traffic
- You select landing pages that have the highest revenue potential (known as money pages) for testing.

The first approach addresses a problem you are facing and tries to fix it. In the second approach, you try to optimize and improve your money pages and, in this case, you might not have any conversion-related issues.
You need to come up with solid findings in this step for A/B testing in terms of what you should be testing and why you need to test it.
For example, you can argue that we need to test our sales page for higher conversions.
You need data from other sources too to validate your findings. Heatmaps, session recordings, usability testing, scroll maps, user surveys, and interviews are a few ways to collect more data.
Identifying a page isn’t enough, rather you need to choose the problematic element on the web page. For example, you figured out that a landing page has low conversions and is underperforming than other landing pages.
That’s the first step.
You need to dig deep and find out possible reasons for the low conversion rate. Is it due to headline, image, CTA, landing page design, copy, or any other element?
This is where you need help from other sources. Heatmaps, for example, will tell you how users interact with the landing page. You can run a short survey on the landing page and ask visitors what they didn’t like. Session recordings will give you visual insights into how visitors interact with the landing page.
List all the possible reasons that are causing the issue (or improvement opportunities) and move to the next step.
Step #2: Hypothesis Development
A hypothesis is defined as a proposition you made based on your research. It is the possible explanation of the problem you are facing and want to test.
The hypothesis needs to be fully backed by data as the success of the A/B test relies on it.
A simple but effective approach to developing a data-driven hypothesis for A/B testing uses the following template:

It should have the following:
- Variable which is an element on the page that you want to test
- Result that is your expected outcome after making the desired change in the variable
- Rationale defines the reasoning behind your variable and result.
Here’s an example of a hypothesis:
If CTA is moved above the fold in the landing page, then conversions will increase due to an increase in the visibility of the CTA.
You don’t have to necessarily write your hypothesis in the same format. You can choose any format you like as long as the variable and expected outcome are explicitly visible.
Here’s another approach to writing a hypothesis for A/B testing by Craig Sullivan:

It includes a metric that tells you how you’ll measure the impact or outcome to evaluate results after the test.
You can choose to derive your hypothesis in any way you like as long as you don’t skip any of the below:
- Hypothesis is testable
- It solves an actual problem especially related to conversion
- It has a single variable and expected outcome
- You can tweak the variable as desired
- You have the resources/tools to measure the outcome.
It is important to note here that the hypothesis needs to be driven by data and not your gut feeling. Just because you can test something and you have this feeling that it will improve performance in some way – doesn’t mean you have to create a hypothesis and test it.
Make sure your hypothesis has a solid rationale that’s either scientifically proven or supported by data.
Step #3: Create Variation
Once you have developed a hypothesis, you’ll know your variable and what changes you have to make.
A variation is another version of the existing variable that has the change you want to test. Control is the original version without any changes.
You can name these two versions A and B or Version 1 and Version 2 or any other you like:

The hypothesis tells you the variable and what changes you have to make.
You’ll move the CTA above the fold in the following hypothesis: If the CTA is moved above the fold in the landing page, then conversions will increase due to an increase in the visibility of the CTA.
There are a few things to consider when creating a variation:
- Only change one element per hypothesis as it makes testing easier
- Make sure the change is clearly visible to the visitors and isn’t hidden at the backend.
Creating a variation means changing the design and there are three ways to do it:
- Use a designer (either in-house or freelancer)
- Edit directly if you are using a theme or template
- Use an A/B testing tool.
Since you have to use an A/B testing tool to run experiments, it is recommended to use the platform for creating variation. Almost all the A/B testing platforms offer you the ability to create variation. More on tools in the next step.
Step #4: A/B Testing
It is time to run the test.
There are a few major things you have to do before you start the test. These include:
- Test both variations and make sure it is working as expected. The change should be reflected to the end users
- Choose the right time for the test. Seasonal products, for example, experience a lot of fluctuations. Similarly, if there is a recent positive or negative press mention, it’ll impact conversions
- Identify test duration which happens to be the most important part as it plays a key role in the significance
- Choose statistical confidence level should be set at least 95%
- A sample size that’s representative of the entire population.
You need enough visitors on both versions for a decent amount of time to find a clear winner. In other words, the sample should be representative of the entire population. It won’t be justified if you conclude a test based on 500 visitors.
For statistical significance, you have to run the test for a decent number of days which is determined based on daily traffic and conversion rate. You can use a free A/B test duration calculator that’s offered by all the leading A/B testing platforms such as VWO:
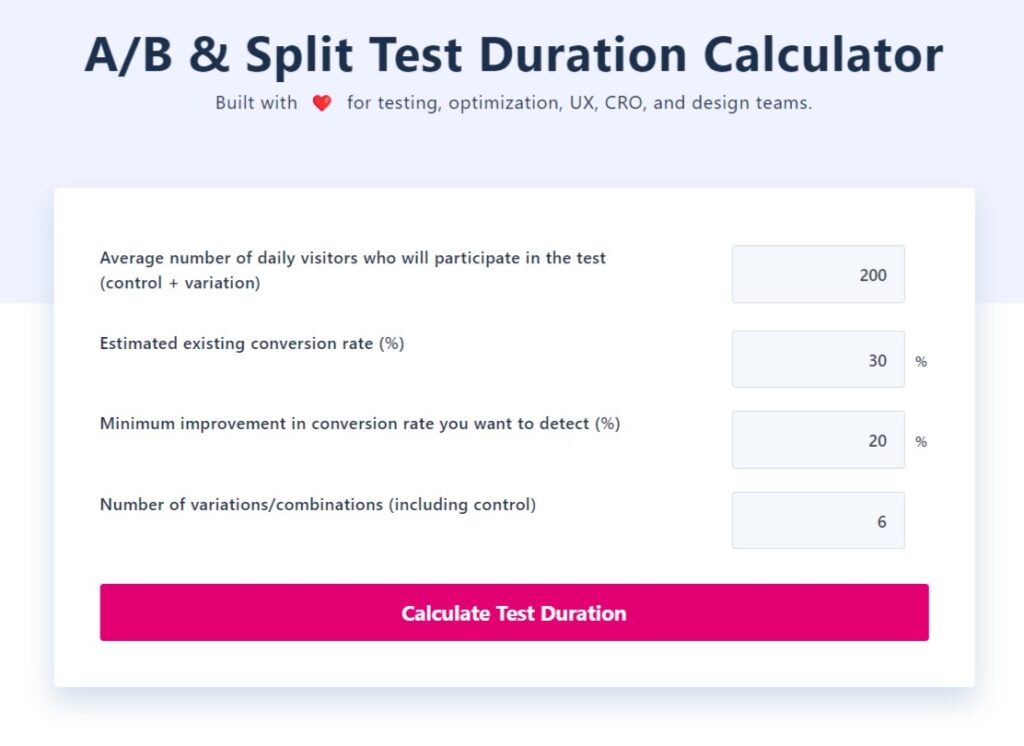
The A/B testing tool will provide you with a sample size based on conversion lift and the number of visitors you receive. If you have a low traffic, it’ll be problematic to get accurate results.
Make sure you receive enough traffic on both versions either paid or free to ensure your test runs successfully.
How to run your test?
Choose an A/B testing platform from the list below and you’ll be all set:
- Hotjar: Free plan that supports 35 daily sessions while paid plans start from $39 per month with up to 100 daily sessions. It is the most cost-effective A/B testing platform that offers a wide range of additional features.
- VWO: Free plan for A/B testing that makes it an ideal deal for small businesses. The paid plans start from $176 per month with an annual billing cycle.
- SiteSpect: It is another cost-effective A/B testing platform that offers multiple options to choose from. You can choose between server-side or client-side software based on your needs. The price is customized.
- Omniconvert: It is a multipurpose platform with tons of features. The A/B testing platform has a starting price of $390 per month making it more expensive than a few others in the market.
- AB Tasty: It is suitable for large businesses with specific experimentation needs. The pricing is customized depending on what services and features you need.
- Optimizely: It is a feature-rich platform that has a lot to offer. It offers customized pricing based on what services you need. The starting price is usually $36K per year making it suitable for large businesses that want to run several A/B tests simultaneously.
Step #5: Analysis
Finally, it is time to analyze test results and make necessary adjustments.
When analyzing test results, look at the following to identify a winner:
- Hypothesis outcome
- Confidence level
- Increase/decrease in the relevant metric (e.g., conversion rate)
- Impact on other related metrics
- Check anomalies
- Look for errors.
One important thing to consider during analysis is errors and anomalies. Were there any errors that impacted the test such as a marketing campaign that your team forgot to pause during the test duration?
When you have a large website with multiple marketing campaigns across multiple channels, your results might not be accurate despite getting a clear winner. You need to check everything during the analysis stage to ensure that the change in the variable was due to your hypothesis – and not due to any other factor.
It is also important to look at other relevant metrics at this stage. An increase in conversion rate with a lower CLV or a high churn rate isn’t necessarily a good sign. Ignoring other metrics is a lethal mistake. You can’t track all the metrics instantly like average order value, CLV, customer loyalty, etc.
Let’s take a hypothetical example.
You moved CTA above the fold for an A/B test which resulted in a significantly high conversion rate. You implemented the changes. After a couple of months, you figured out that the churn rate has skyrocketed. An investigation revealed that moving CTA above the fold forces visitors to convert with unclear expectations about your offer since the benefits of the offer are listed below the fold. Most customers skipped the landing page copy and opted for the offer right away.
This resulted in a high churn rate due to inaccurate expectations.
These types of mistakes are quite common and often ignored by marketers. You should measure the impact of an A/B test for at least 3 months. It should be a continuous process.

Both A/B testing and its analysis should be continuous and never-ending processes where you keep on testing other elements to improve conversion rate and other metrics.
Here’s an example of fictional hypotheses by Squarespace where they create a new hypothesis based on the results of the previous test:
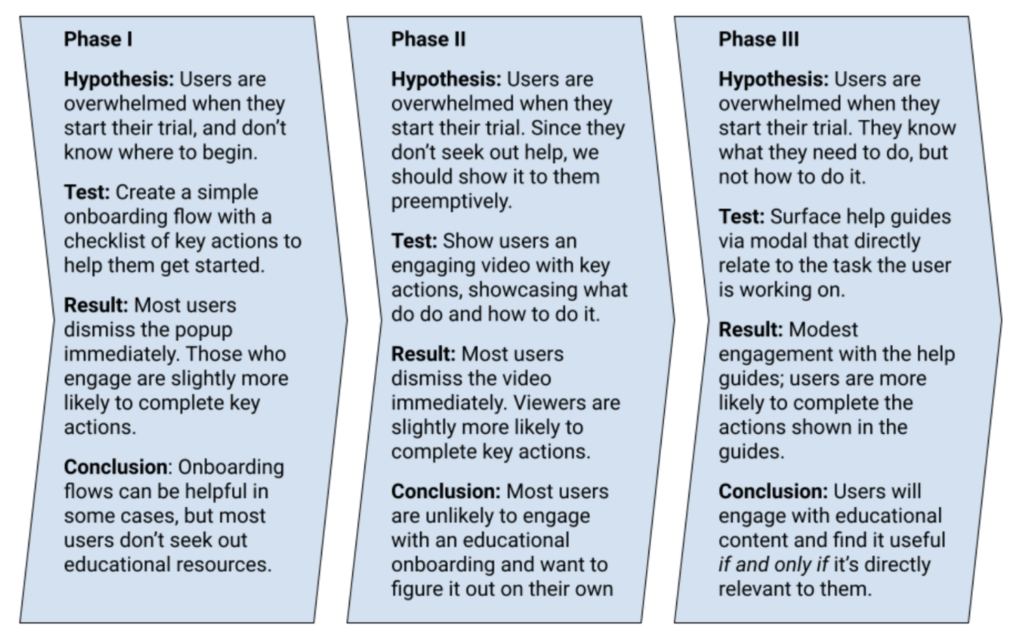
Don’t stop after one A/B test. Use results (successful or unsuccessful) to create new hypotheses and continue testing. That’s how you evolve and grow.
A/B Testing Mistakes and How to Avoid Them
Split testing is a technical process that involves multiple departments and teams. The process is automated, but this doesn’t mean it’s not prone to flaws.
Here’s a list of the common A/B test mistakes and how you should avoid them:
- Inaccurate hypothesis development is one of the major mistakes that a lot of marketers, businesses, and even agencies make. Hypothesis defines the purpose of an A/B test and if you don’t have a clearly defined, data-backed hypothesis, you’ll end up being nowhere. Make sure the hypothesis has a rationale and is based on data – not intuition.
- Running an A/B test for low traffic sites. If your site doesn’t receive enough traffic or if you don’t have enough sources to generate paid traffic during the A/B test campaign, don’t run a test. Experimentation requires a decent amount of traffic for generalizability and statistical significance. Use free sample size and A/B test duration calculators to find out how much traffic you need to run a split test successfully.
- Testing more than one variation at a time. This is suicidal and a waste of resources because when you make more than a single tweak to a variation, you can’t be certain what change impacted the outcome. And you’ll have to re-run the test. Always make one change per variation per test. This provides a certain result that you can trust and implement with confidence.
- Running test for a short duration. A/B tests are tricky and often you’ll have a series of hypotheses to test but due to low traffic and limited resources, you end up running one test at a time. This gets frustrating and marketers often end tests way too early. This leads to insignificant results. Make sure you run the test to achieve 95% significance. This is a bare minimum. Most A/B testing tools are set to 95% significance by default. Don’t stop your test before reaching 95% statistical significance.
- Not running A/B tests iteratively. Experimentation is a continuous process. The results from one test should be used as a hypothesis for the next test. Most businesses stop testing when their test fails or even passes. It is a never-ending process that should be a part of your marketing strategy.
Conclusion
Research shows that 52% of businesses say they don’t have enough time to run A/B tests while large businesses like Google and Amazon perform more than 10,000 A/B tests per year consistently.
There is a reason why large businesses invest their time and resources in experimentation.
A/B testing is a highly effective way to optimize your website, product, and app. The data you generate in the process is priceless.
You can use session recordings, for example, during the test to see how users interact with the variation. Even if the test fails, you’ll get to know a lot about the variation and how your audience interacts with it.
The platforms you use for testing offer a wide range of features that help businesses improve UX across all funnel stages. Consider using them for your business.
Featured Image: Pexels


