Google Analytics 4 is no less than a goldmine for marketers.
One of the major challenges online marketers face is related to the performance and effectiveness of their campaigns and strategy.
In 9 out of 10 cases, data is the culprit.
It’s either poor data collection, a lack of proper data interpretation, or not using data for marketing at all.
Google Analytics 4 solves this issue at zero cost.
It all comes down to how you use heaps of data collected by GA4.
This article explores everything you need to know about Google Analytics 4 as a marketer and how to use it to improve marketing performance.
What is Google Analytics 4?
Google Analytics 4 (GA4) is a web analytics tool that collects data from your website (and mobile app) and lets you understand how your target audience interacts with your website. It tracks a wide range of events that include the basic ones, like clicks and advanced events like purchase or conversion.
The focus of GA4 is on ‘events’ which collect data on what actions visitors take on your website and how they interact with your site or app.
You can create events based on your business and niche.
For instance, if you are in the service sector, you can create an event on your contact form to track lead generation. Ecommerce stores, on the other hand, can track events on the checkout page and track purchases.
Benefits of Using Google Analytics 4 for Marketers
GA4 offers a wide range of reports and analytics that help you make informed decisions. This detailed analytics is no less than a goldmine for marketers (provided they use it correctly).
Below is a list of the major reasons and benefits of using GA4 as a marketer and why you have to take the pain to set it up for your business:
Understand Your Audience Better
The best thing about using any analytics tool is that it provides you with detailed insights into your target audience, potential customers, and existing customers. This invaluable data can be used in a wide range of marketing techniques, such as updating your buyer personas and keeping them current.
Google Analytics 4 excels in providing such insights for two main reasons:
- It tracks the entire customer journey including conversions and key actions visitors take on your website
- It leverages machine learning that helps you in predicting user behavior accurately.
Importantly, GA4 tracks user activity across all platforms – not just your website or app. It makes cross-device and cross-platform tracking much easier and simpler. Thanks to its User-ID, Device-ID, and Google Signals which make this type of tracking much smoother.
Imagine, this is how a typical customer journey looks like as it’s always non-linear:
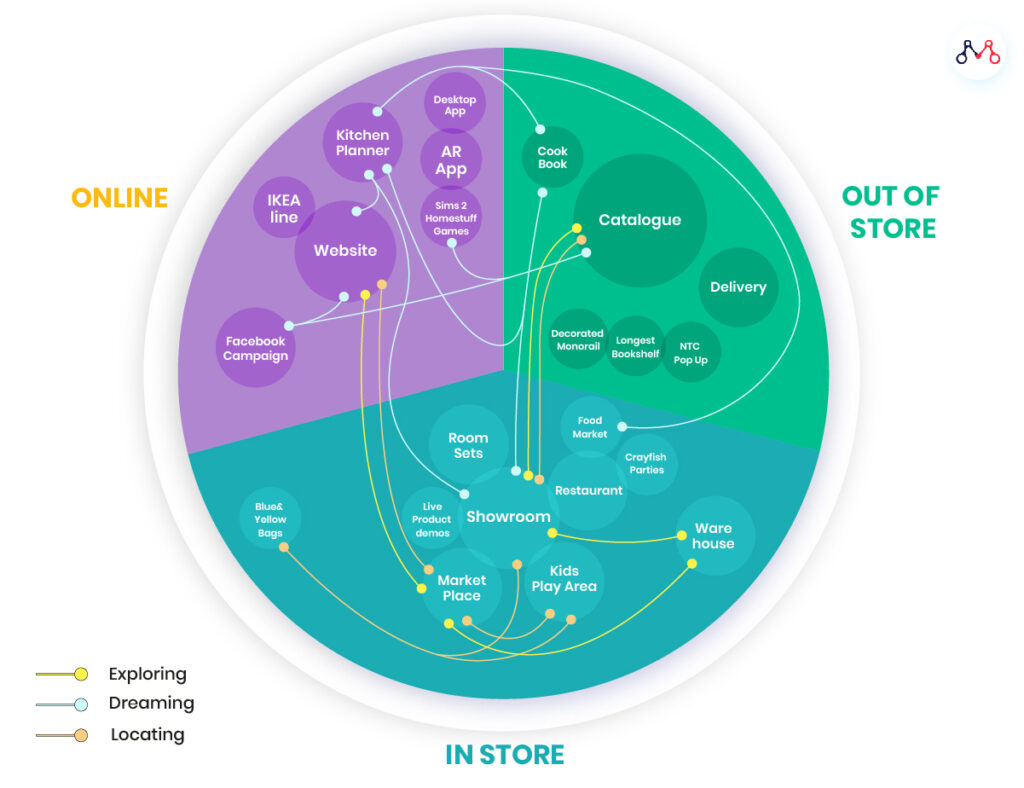
It’s easier to track online interactions on your website, but you miss interactions in-store and out of store, which are hard to track. Google Analytics 4 won’t track them offline, but it makes it easy to visualize the customer journey as it uses User-IDs.
So, when a person visits your website and then later completes the purchase in a physical store, you’ll be able to know this in GA4.
That’s really helpful from a marketing perspective.
Track Content and SEO Performance
Google Analytics 4 is great at guiding your SEO strategy.
You need to use Google Search Console and link it with your GA4 to get more detailed insights about content, keywords, rankings, CTR, and more.
GA4 tells you a lot about content and SEO performance when it’s integrated with Search Console. Some of the key areas it helps you include:
- Keywords your site is ranking for
- Clicks, impressions, position, and average CTR
- Top and low performing content and pages on your site
- Pages with the highest drop-offs
- Engagement across your site
- Clicks and events per page.
What’s best about this data is that it’s accurate as it’s directly coming from Google.
For instance, a third-party tool like Ahrefs or Semrush will track keyword ranking of your website, but it’s not as accurate as what you find in Search Console.
Data accuracy means a lot when you have to make key SEO decisions. Google Analytics 4 doesn’t disappoint you.
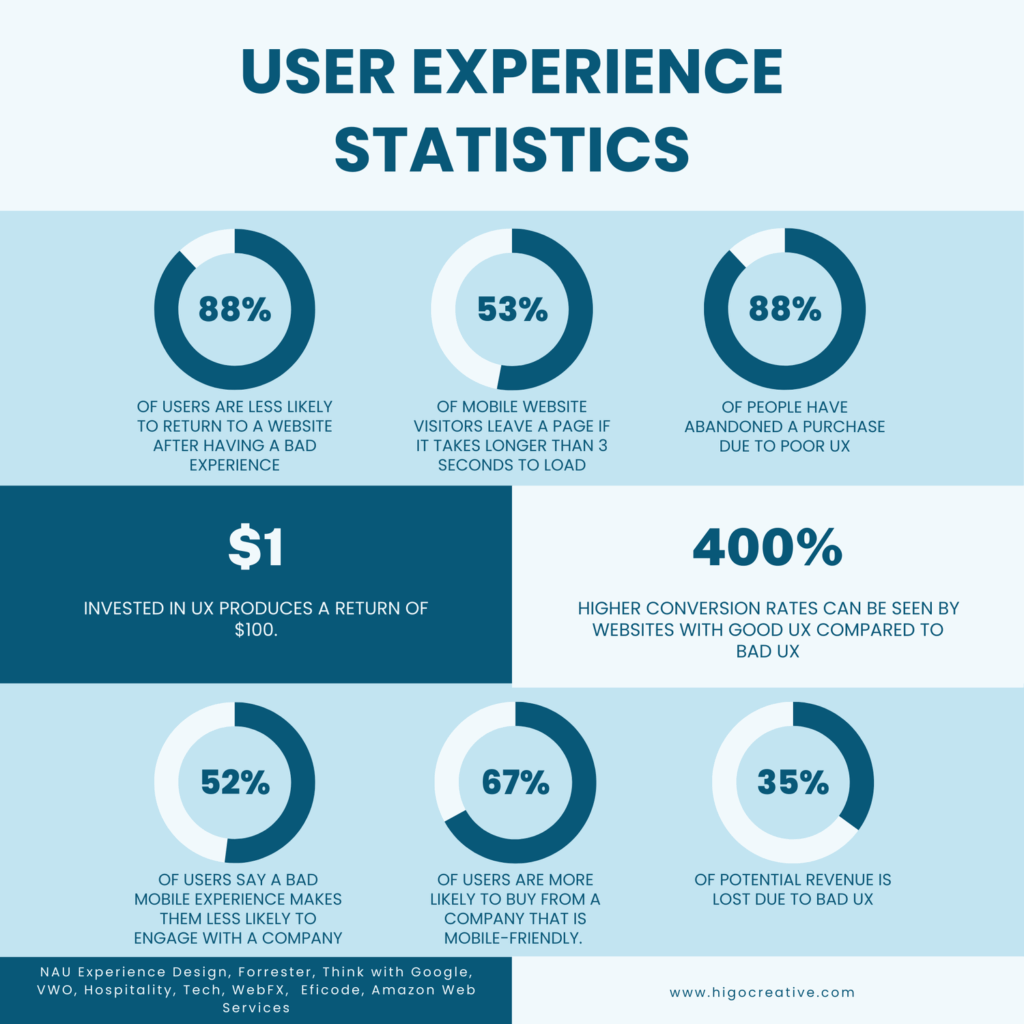
Improve User Experience
Research shows that up to 35% of revenue is lost due to poor user experience, as 88% of people will abandon their carts due to bad UX:
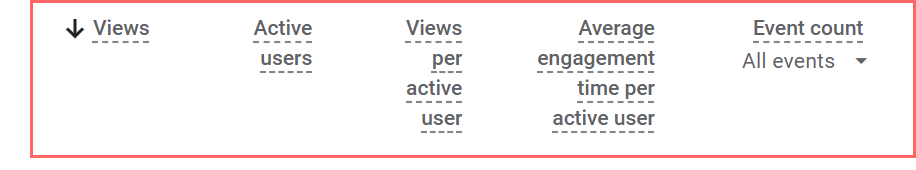
Google Analytics 4 can help you overcome common UX challenges. It tracks and reports multiple UX metrics such as:
- Engagement rate and engagement time
- Conversions
- User retention
- Bounce rate
- Event count
- Scroll
- Pageviews and views.
You can inspect these metrics at the page level for a better understanding of user experience at a deeper level than tracking it for the entire website.
This type of advanced yet reliable data is extremely helpful in improving your site’s UX which directly impacts marketing, conversions, and revenue.
Measure Conversions
Tracking conversions, especially micro-conversions, is pretty hard. Google Analytics 4 has built-in features to track conversions on its own.
On top of that, you can track any type of conversion or interaction by creating events. All you have to do is create an event for the micro-conversion you want to track. This is super-easy as you have to fill a form like this:

GA4 tracks numerous key events by default which cover almost all types of conversions, such as:
- File download
- Form submit
- Form start
- Scroll
- Video start
- View search results
- Session start
- Page view.
It tracks pretty much all of the macro conversions. If you have specific requirements for micro conversions, you can set them up.
This feature is quite handy in proving marketing ROI which is always a challenging task for marketers. You can track marketing performance across channels and touchpoints easily by setting up relevant events in GA4.
Predictive Metrics
This is where it gets interesting.
Google Analytics 4 uses machine learning to predict user behavior. This is quite helpful in making informed decisions for your store.
The key predictive metrics include:
- Purchase probability
- Churn probability
- Predicted revenue
- In-app purchase probability.
This feature is only available for ecommerce stores (as of now).
You can create predictive audiences based on these user behaviors and then target them via marketing campaigns.
It uses machine learning and might not be 100% accurate, but it’s quite helpful in marketing.
You can create highly targeted marketing campaigns (such as Google Ads) to target these groups. For instance, you can offer special discounts or offers to users who have a high probability of churning.
Getting Started with Google Analytics 4
To get the most out of GA4 as a marketer, it’s important that you set it up correctly and connect it with the right apps.
Let’s get started with setting up Google Analytics 4:
Step #1: Create Your Account
Visit Google Marketing Platform to sign in to Google Analytics from your existing Google account. Click Get started today to sign in to Google Analytics and set up your first property:
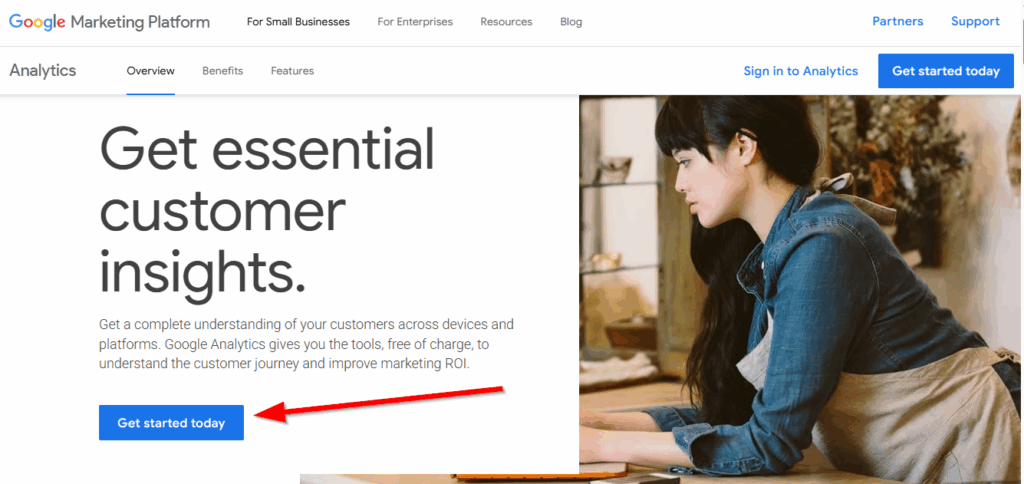
You’ll be asked to create your account with Analytics to get started. Add an account name and proceed to the next step:
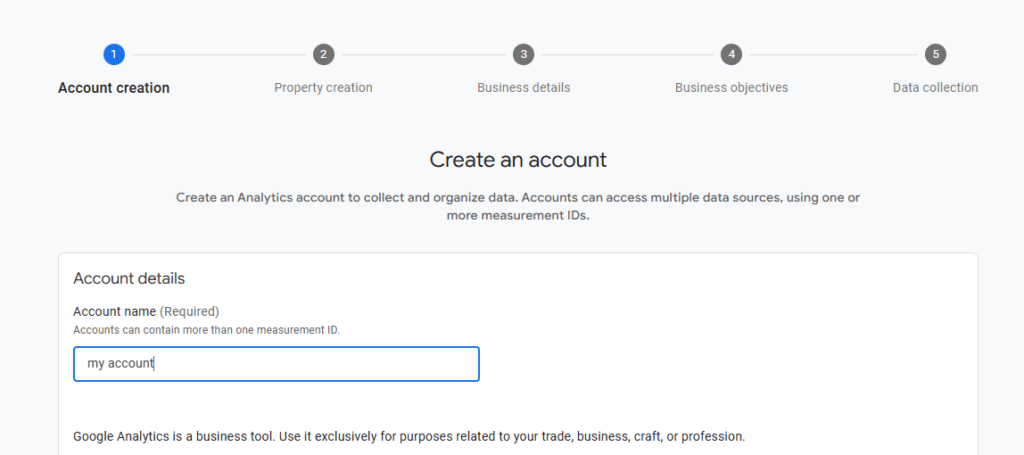
The name should be descriptive and must be related to your website.
Step #2: Set up Your Property
The second step in the account creation process is where you have to set up your property.
Google defines a property as a group of data from your website or app. It holds all the data and reports, and it represents one website or app or both. It’s your business entity.
You can add multiple properties in a single GA4 account, where each property represents one website or an app (if it has one).
Add a name to your property that’s descriptive and helps you identify your website:
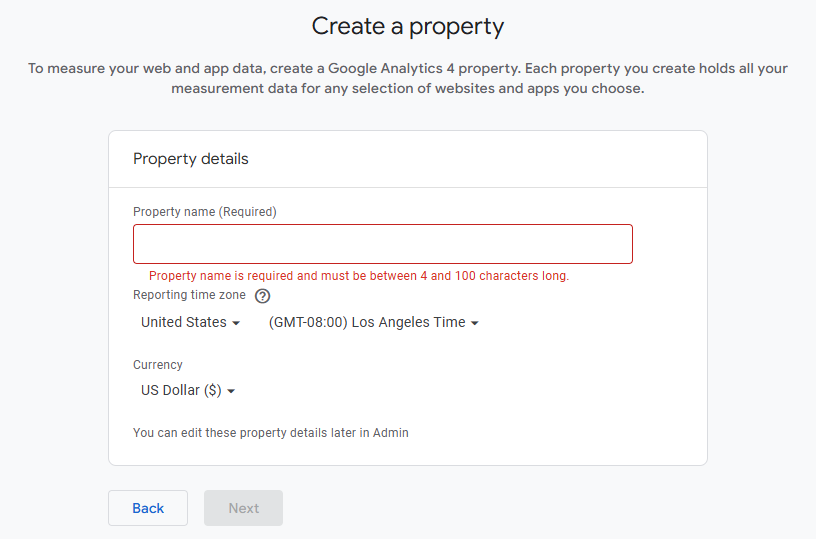
Select appropriate reporting time and currency for your property. Once done, click Next.
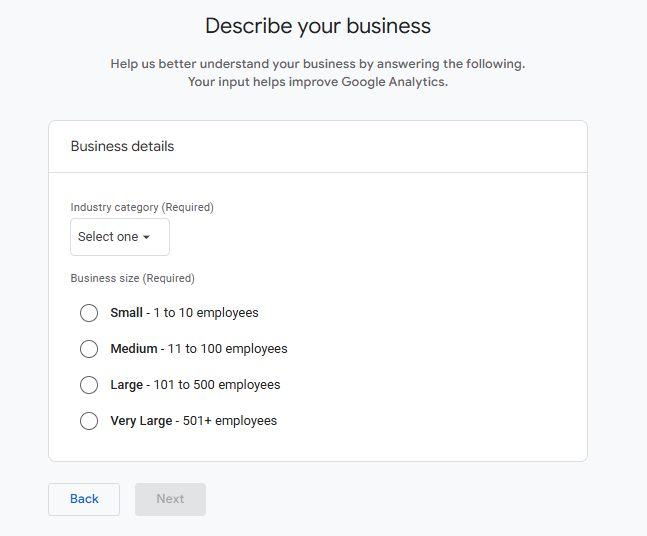
You will be asked to add your business details which include category and business size:
The next step is where you have to choose business objectives. You can choose multiple objectives that should be related to your business process.
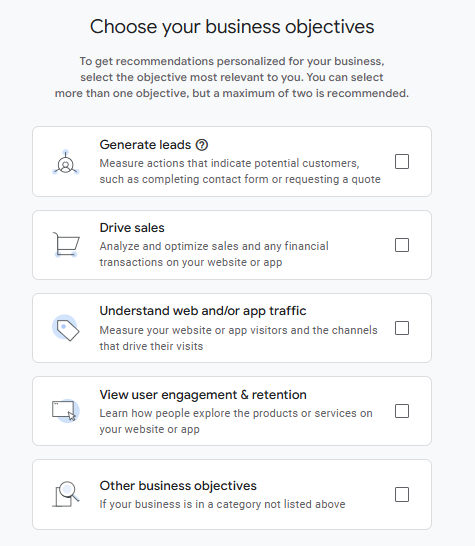
For instance, if you are in a B2B niche and use your website for lead generation, choose to generate leads as your business objectives.
Click Create and accept Google Analytics ToS to finalize your property creation.
Step #3: Choose Data Stream
Once your property is created, the next step is the selection of your data stream.
A data stream is the source of data for your property. It’s where data is collected by GA4. There are three platforms for data collection to choose from:
- Web
- Android app
- iOS app.
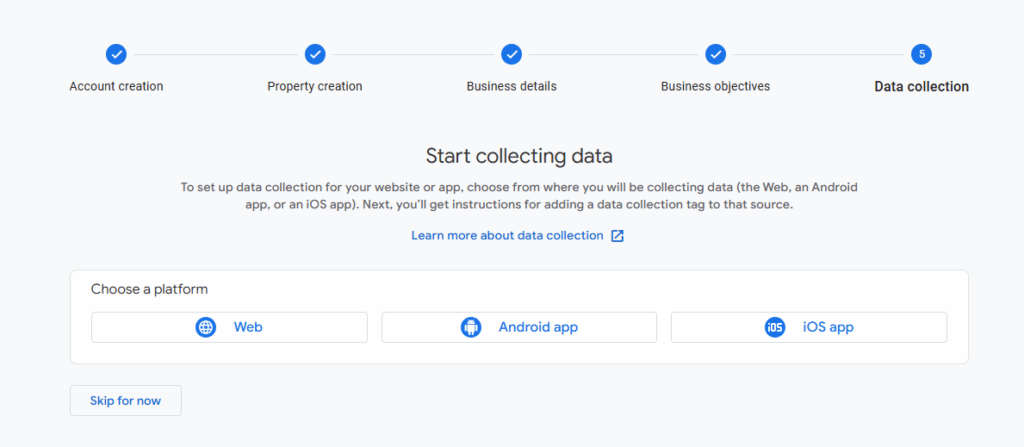
Choose a relevant platform and add details.
In this case, I selected Web and it asked me to add a URL and give a name to the stream:
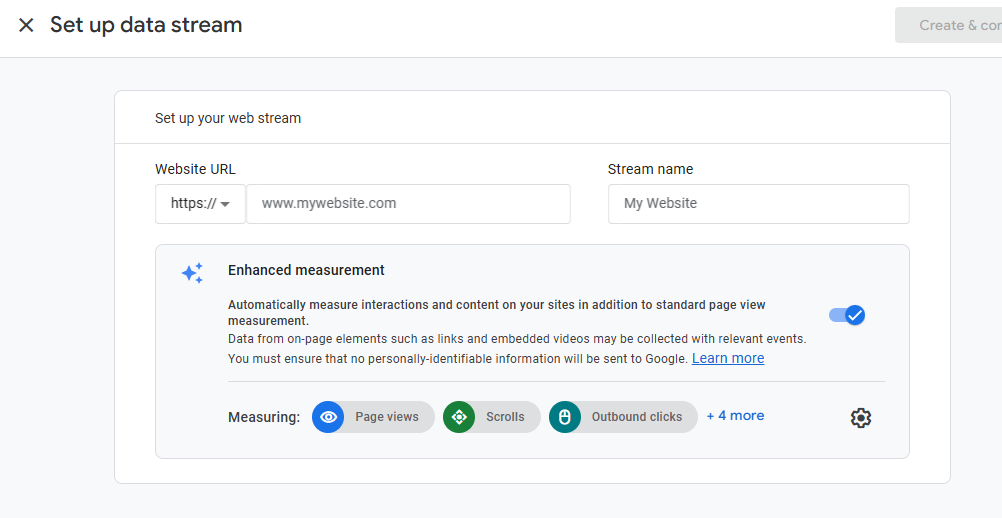
Keep Enhanced measurement turned on as it automatically measures interactions.
Click Create & continue to finish settings.
Step #4: Add Code to Your Website
As soon as you create a data stream, Google Analytics will ask you to set up a Google tag.
You need to copy and paste the code on every page of your website. You can either do it manually or install it with a CMS.
For example, if you are using WordPress. You can install the Google Site Kit plugin and link your GA4 account with it easily. It will streamline everything for you.
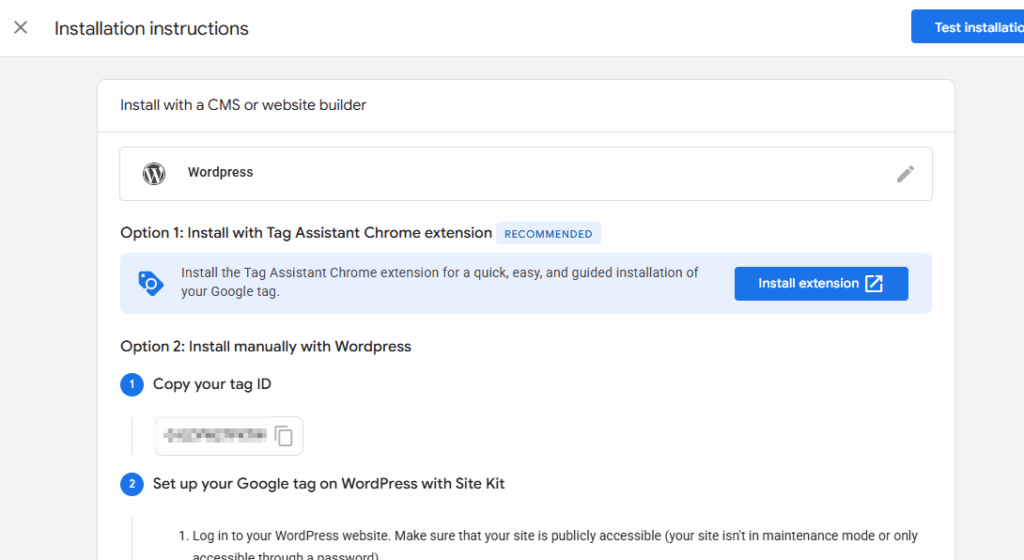
It’s recommended to use CMS to install code and begin tracking.
You get all the instructions and steps on the installation page to make your code functional. All you have to do is follow the instructions depending on what method and CMS you choose.
Step #5: Link with Other Google Products
It’s important to link your GA4 account with other Google products, especially Google Ads and Google Search Console. If you don’t intend to use Google Ads, you can skip it.
But if you use Google Ads, you must link your account with GA4 to get better insights about your ad campaigns.
Search Console is a must-have as it lets you see organic search performance in GA4. You can analyze how organic visitors interact with your website, what search queries are driving traffic, and more useful data.
Here’s how to link Search Console with Google Analytics:
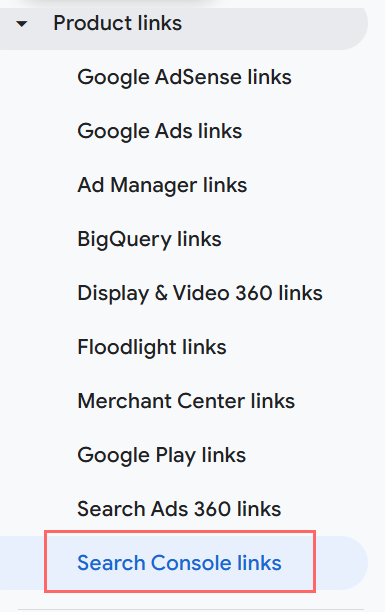
Click Admin from your Analytics account and select Product Links to view all the available products that can be linked:
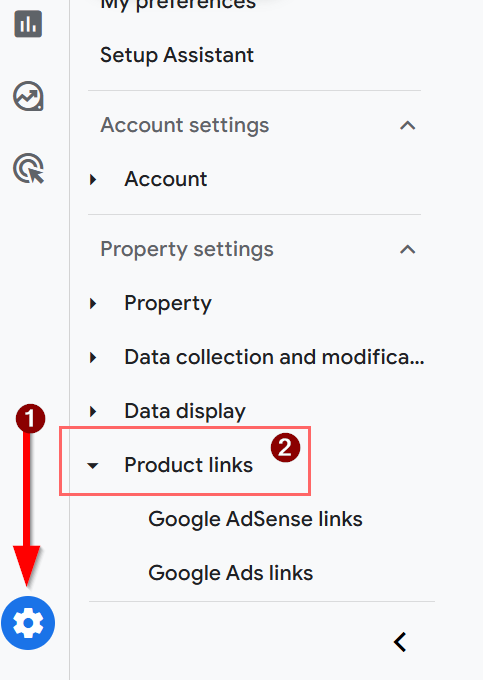
Choose Search Console links:
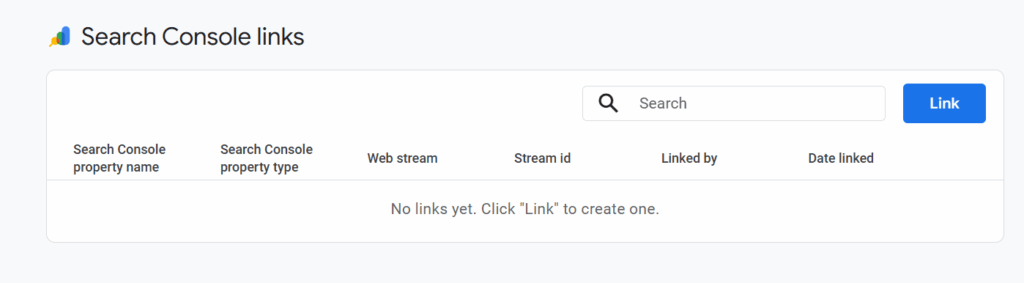
Click Link to create a new link:
You’ll be asked to choose a Search Console property by choosing an account. You must have created a property for the domain in Search Console already and you must have access to the Search Console.
Google will show you all the properties you have access to in your Search Console account. So, it should already be in your account.
Click Choose accounts and select the relevant property you manage from your account:

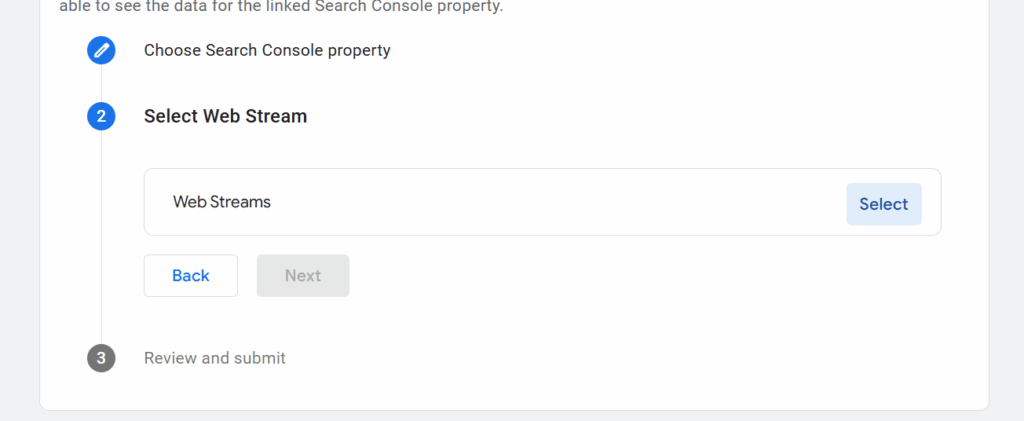
Once done, select the Web Stream in the Google Analytics account for the same property you just linked. Google will only show you relevant streams that match the selected property, so you can’t end up messing anything up:
Finally, review the Search Console property and the Web Stream you are linking it to. They must have the same domain:

Click Submit to complete linking.
Google Analytics 4 Reports and How to Use Them
Let’s jump to the real business.
Google Analytics 4 has an intuitive, customizable dashboard. It generates multiple reports for you that you can use for decision-making and all types of data analysis.
What’s important is how you use this data. This is what I’ll focus on in this section.
Life Cycle Reports
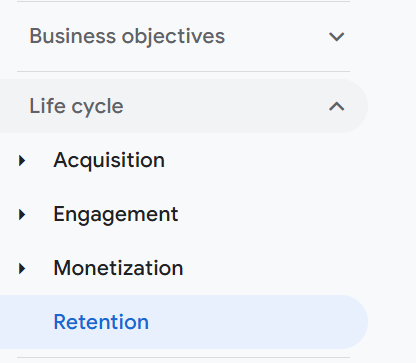
You can access default reports by clicking Reports from your Analytics dashboard. You’ll see 5 types of reporting heads:
- Realtime
- Business objectives
- Life cycle
- Search console
- User.

The Life cycle head has your funnel with pre-generated reports for Acquisition, Engagement, Monetization, and Retention.
This covers your sales funnel and customer journey. Google might change it based on your industry (which you select when creating a new property, but it can be changed at any time).
It shows you how you acquire customers, how they are engaged with your site and content, sales and purchase data, and finally, customer retention data.
Let’s cover each of these reports in detail:
Acquisition
It gives you a complete overview of how you acquire users. It includes user, traffic, and lead acquisition reports:

Acquisition reports give you an overview of the top of the funnel. It’s the awareness stage of the funnel, and it should be interpreted as such.
The user acquisition report, for instance, breaks down primary channels where you acquire users from. These include organic, direct, referral, social, and others.
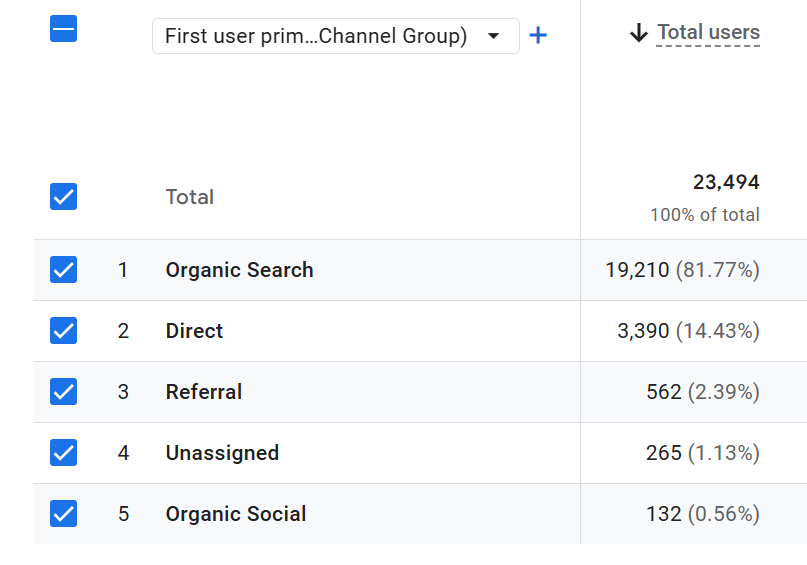
You can use the first source medium to find the exact source of traffic. For instance, it will show you search engines where you get traffic from and sites that send the most referral traffic.
You can inspect top search engines, top pages that drive most traffic, search queries that get most clicks, and engagement across all the pages.
Here’s how you can use this data in marketing campaigns:
- Identify top performing traffic sources
- Find out the content that generates the most traffic
- Compare how spending on different platforms corresponds with the output
- The biggest sources of referral traffic and how to acquire more such links and mentions.
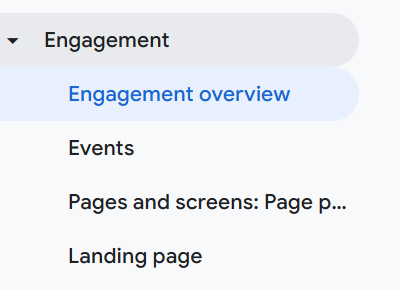
Engagement
These reports show you how users interact with your site once they find you. It’s mid-funnel where users interact with your site and develop interest in your business and products.
This is where you’ll find top performing pages, top search queries, what actions users take on your website (even counts), views per page, user stickiness, and other engagement metrics.
Pages and screens is an important report that shows you the time spent on each page and event counts per page. It’s a very detailed report that’s quite handy. It gives you a complete overview of what content is doing well, why it’s doing well, and what’s not performing.
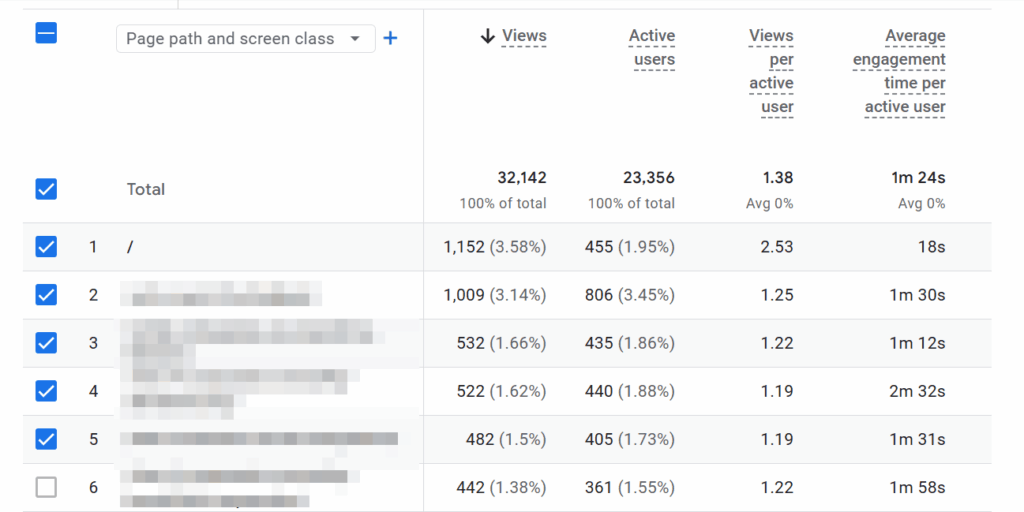
This helps you find weak areas on your website.
For instance, a blog post that has decent traffic but less than average engagement time needs to be inspected as something on the page isn’t working.
Similarly, you can find out what type of content has the highest engagement in terms of time spent and conversions. You can create similar content to up your content marketing game.
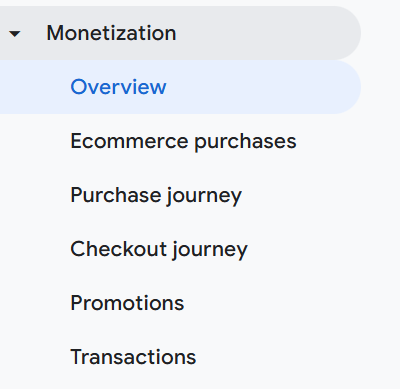
Monetization
Depending on your industry, you might have a different section here that’s related to your business model.
Monetization is at the bottom of the funnel, where conversion takes place and users become customers. You’ll see purchase data for ecommerce stores, ad revenue for ad-based sites, leads for B2B, etc.
You can analyze the complete checkout journey, top purchased items, transactions, and other key details.
Here’s how you can use this data to improve marketing:
- Find underperforming and top performing products
- Visualize the purchase journey and find and fix loopholes
- Optimize checkout journey by fixing leaks
- Find the best products that have a high conversion rate for your next marketing campaign.
Retention
It’s the final stage in the funnel where you can see the customer retention rate.
It shows you new vs. returning visitors and customers and trends over time. This report is helpful for some types of businesses, such as ecommerce and SaaS, or any business that sells to the end users.
You can monitor retention trends and see if it’s increasing, declining, or constant. The dips in retention rate need to be evaluated. Figure out what changes you made in marketing or business strategy that led to a decrease in retention rate.
And vice versa.
It’s a handy report that helps you improve AOV, CLV, and customer satisfaction.
User Reports
These are additional reports that you can use to find details about your audience. It includes details such as demographics, platforms they use, devices, browsers, screen resolutions, and much more.
There are two major types of reports you find under User:
- Attributes cover demographics mostly
- Tech includes all the technology-related details about the users.
What makes these reports interesting is the fact that you get heaps of data about actual users who interact with your website. This data can be used in numerous ways:
- Update buyer personas using these reports
- Improve targeting for PPC campaigns by precisely targeting people based on the devices they use
- Optimize your website and marketing collateral based on the most common devices, screens, and platforms used by your audience
- Improve content and offers by matching with the demographics of your audience.
Here’s a report that shows the screen resolutions of the users from the last month. It shows that the majority of the traffic originates from desktop devices:
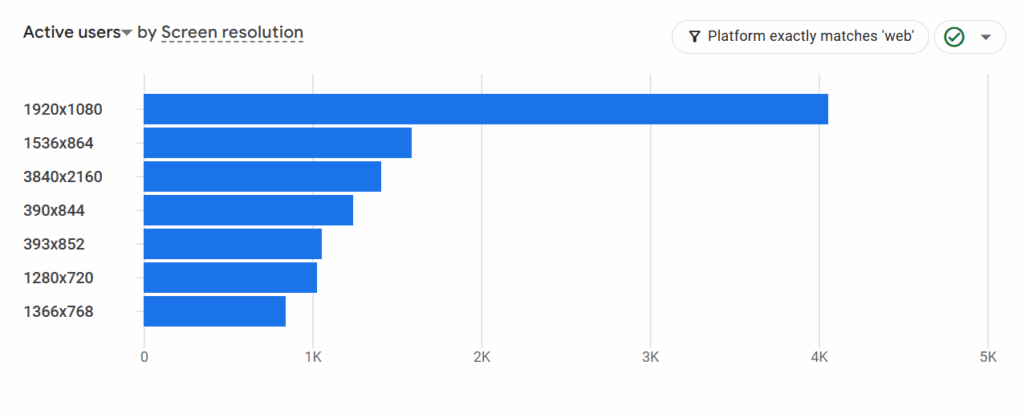
You clearly have to focus more on the desktop version of your site. See your site’s load speed and Core Web Vitals for the desktop and optimize it.
If you have to send emails to your customers, make sure they are optimized for desktop.
And so on.
You need to make sure you use this data for all types of marketing and non-marketing decisions.
Final Words
Google Analytics 4 is an upgraded and better version of the previous Universal Analytics (UA). If you have successfully set it up for your website, you are on the right track.
But that’s just the beginning.
What really matters is how you use GA4 for marketing. You should use it to improve marketing and for better decision-making.
If you’ll just let it sit and collect all the data, it won’t be of any use.
Don’t let Google Analytics 4 just be another tool in your martech stack.
Make it count by using its data to improve marketing across all channels.
Featured Image: Pexels