Marketing KPIs simplify measuring marketing performance which is one of the biggest challenges faced by marketers globally.
Tracking marketing performance accurately and then using it for decision-making is indeed a challenge.
Smart marketers use a certain number of marketing KPIs that help them stay ahead of their competitors. You don’t have to track every single KPI, only the ones that matter the most.
This guide explores the most important marketing KPIs you should track with an explanation of why these matter.
What is a Marketing KPI?
A marketing KPI (key performance indicator) is a quantitative value that is used to measure marketing performance. The two major characteristics of a marketing KPI are:
- Quantitative value: It’s a measurable, numerical value that helps you track marketing success with real, tangible results.
- Goal-oriented: KPIs are associated with marketing goals. You can track how effectively your marketing efforts are achieving set goals.
Customer acquisition cost (CAC) is a marketing KPI that is a quantifiable value that helps you understand the cost you pay to acquire a new customer (which is its goal-based aspect).
Marketing KPIs are exceptionally great at:
- Measuring marketing effectiveness
- Comparing performance across businesses to see where you stand with respect to your competitors
- Identifying problems on time and addressing inefficiencies
- Providing data-driven insights to help you make well-informed marketing decisions
- Tracking goals and their progress.
Top Marketing KPIs to Track
Let’s get to business.
Below is a list of the top marketing KPIs you must track irrespective of your business age, industry, and location. These KPIs are a must-have for all small and large businesses.
Marketing Return on Investment
Marketing return on investment (MROI) or return on marketing investment (ROMI) is a core marketing KPI that measures the return in the form of profit from marketing activities (specifically) in comparison to the total marketing cost.
It’s a percentage that shows you the earnings on your marketing spend.
For instance, an ROI of 10% means you made 10% profit on marketing cost. Here’s how to calculate marketing ROI:
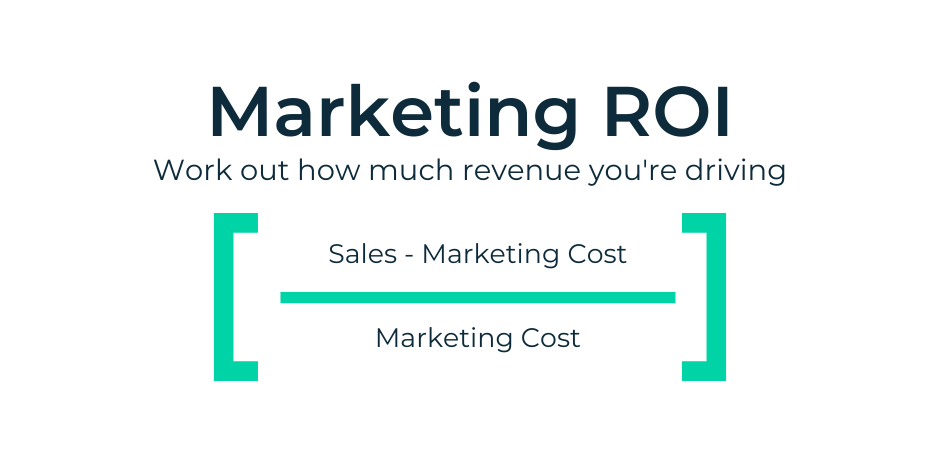
You can replace sales revenue or net profit to measure revenue or profit generated through marketing spend.
It requires precise marketing cost for accurate calculation. It doesn’t just include ad spend, but marketing cost should include everything including:
- Salaries and wages
- Martech
- Events and PR expenses
- Other indirect marketing costs.
Correctly calculated marketing ROI helps optimize marketing budget and tweak campaigns based on their performance. You can calculate it at the campaign level which lets you compare campaign performance within your business and channelize marketing budget.
Impressions
Impressions refer to the number of times any marketing asset is displayed and viewed by your audience. It only accounts for views received irrespective of whether a view was from your target audience or a random user, or whether it led to any click or other action.
It is a measure of brand awareness, reach, and frequency that tracks total views of a marketing asset.
There are two primary types of impressions in marketing:
- Paid impressions that are generated from an ad
- Organic impressions refer to views received in SERPs organically.
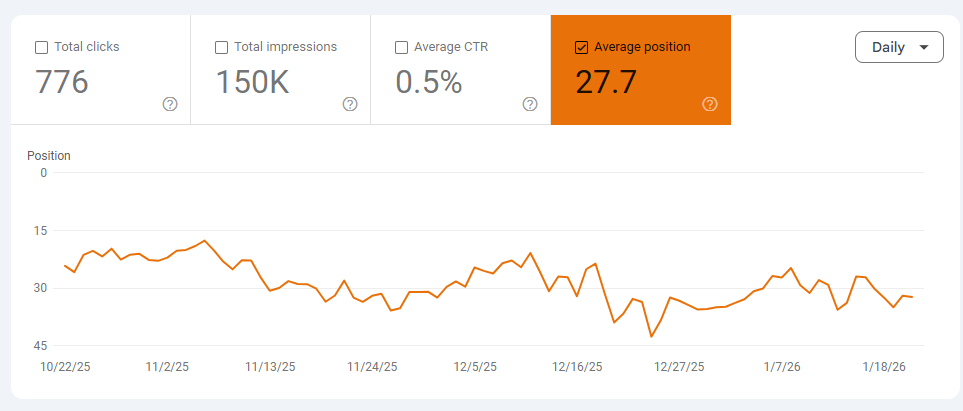
Impressions for an ad are displayed by the ad network, while organic impressions can be tracked via an analytics tool. Google Search Console, for instance, displays impressions for your website:
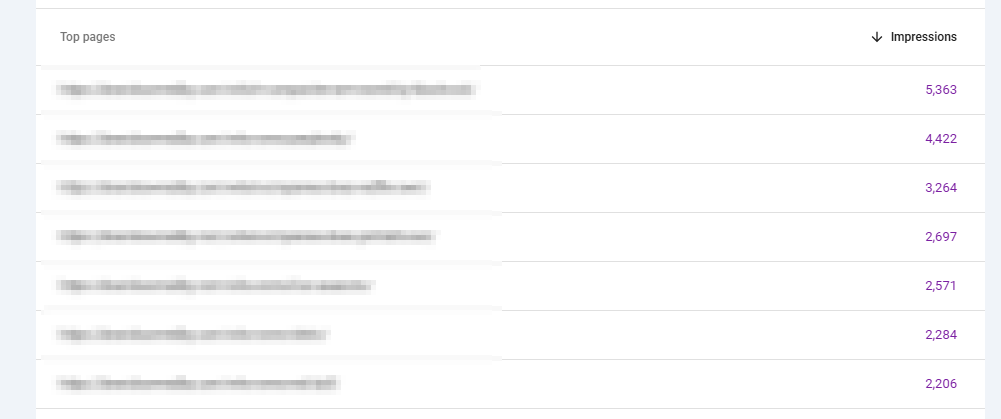
It’s a crucial marketing KPI that helps you track reach and brand awareness across all touchpoints.
Click-Through Rate
Click-through rate (CTR) is the percentage of people who click on a marketing asset they see compared to total impressions. It is calculated by dividing clicks by impressions for a specific campaign and multiplying it by 100:
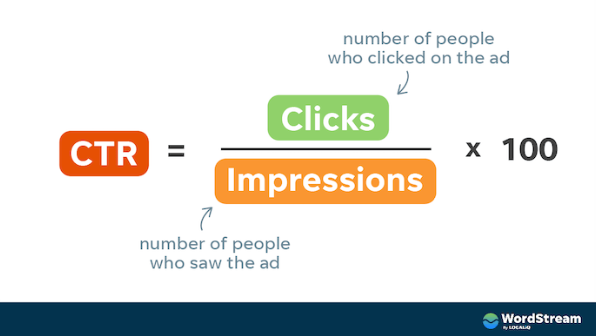
CTR measures the effectiveness of a marketing asset such as an ad or an organic search result. A high CTR indicates people find marketing collateral interesting, relevant, and engaging and eventually, end up clicking it.
For ad campaigns, CTR is reported by the ad network. Search Console reports organic CTR just like impressions to help you get an idea of how pages are performing in SERPs.
Conversion Rate
It is the percentage of people who take a desired (conversion) action once they visit your website or a landing page. Conversion refers to any action you want your audience to take. This might include both micro and macro conversions such as:
- Submitting a form
- Adding product to cart
- Newsletter subscription
- Product purchase.
Conversion rate tells you the percentage of people who enter your conversion or sales funnel. A high conversion rate means people aren’t leaving your website. Rather, they are taking the desired action which you want them to take (a measure of marketing success).
It is calculated by dividing total conversions for a specific marketing campaign by the total number of visitors to a specific landing page. Multiply the resulting number by 100 to convert it into a percentage:
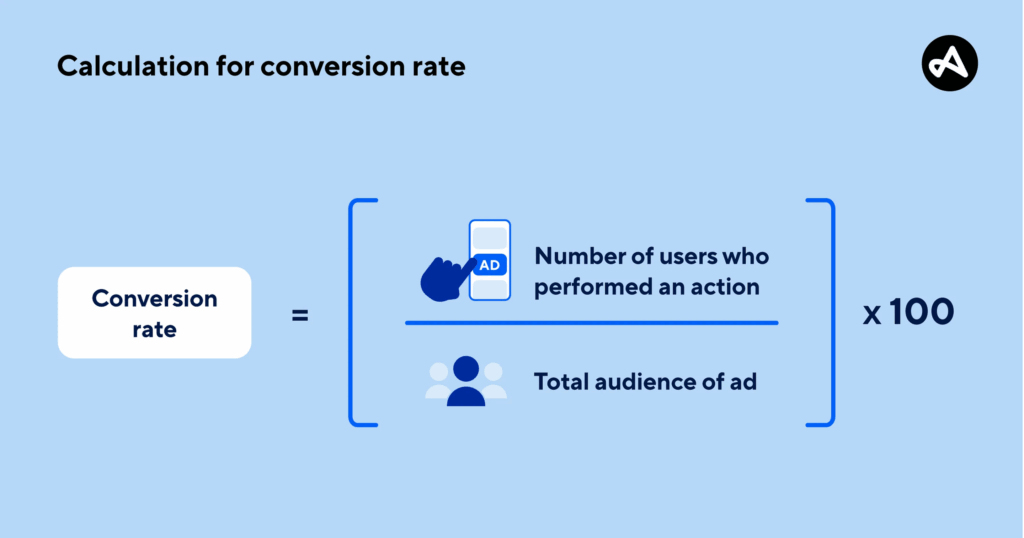
Conversion rate is one of the core marketing KPIs that measures marketing success quite effectively. Clicks and impressions don’t track true performance as they don’t impact the bottom line. Conversion rate is different because it tracks actions, not mere clicks or views.
Since it’s a percentage, comparing conversion rate across businesses and campaigns for the same business is much easier. If you have to choose between two marketing campaigns, a simple rule is to go with the one with a high conversion rate.
Customer Acquisition Cost
Customer acquisition cost (CAC) measures the total cost your business incurs to acquire a new customer. It includes all types of costs associated with getting a new customer.
CAC is calculated using the following formula:
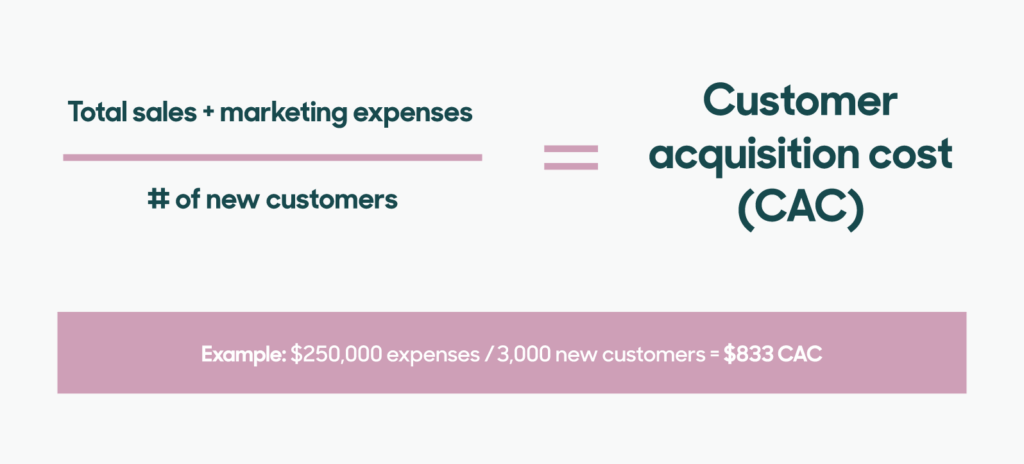
The accuracy of CAC depends on the calculation. You need to have exact, granular expense details of all types of sales and marketing activities that are directly (or indirectly) associated with customer acquisition.
It’s not just ad campaign cost or content creation cost, it should include end-to-end marketing and sales costs.
Customer Lifetime Value
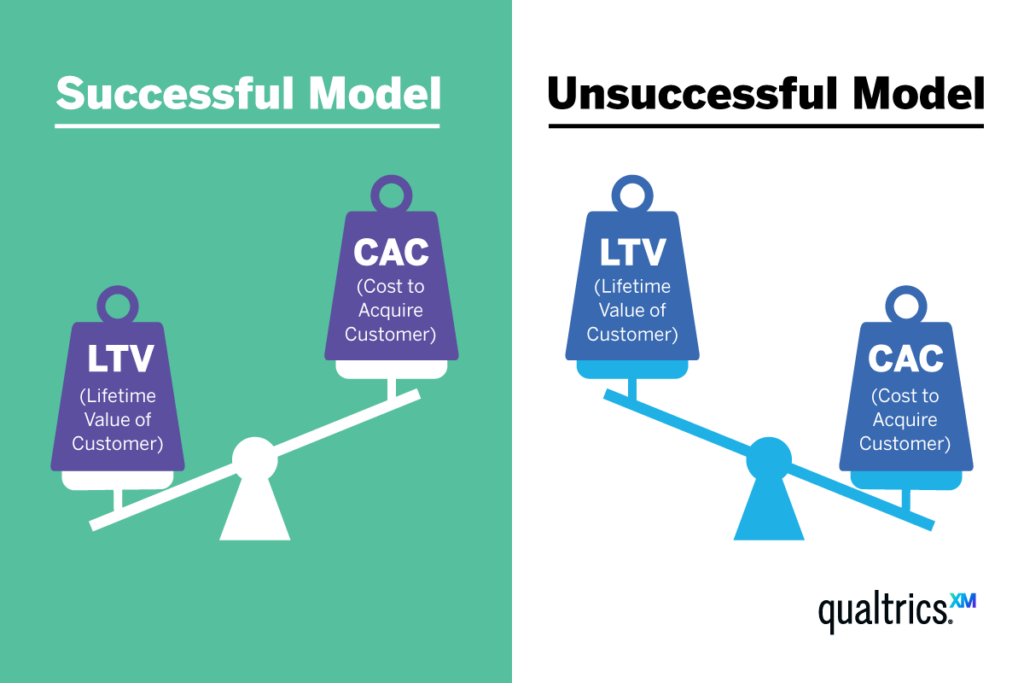
Customer lifetime value (CLV or LTV) refers to the total revenue your business is expected to generate per customer. It is the revenue that is generated per customer for the entire lifetime with your brand.
CLV is one of the most important marketing KPIs as it tells you how profitable your business is and helps estimate long-term profitability. It also helps you maintain a profitable business model where your CAC should be lower than CLV:
Here’s the formula to calculate LTV:
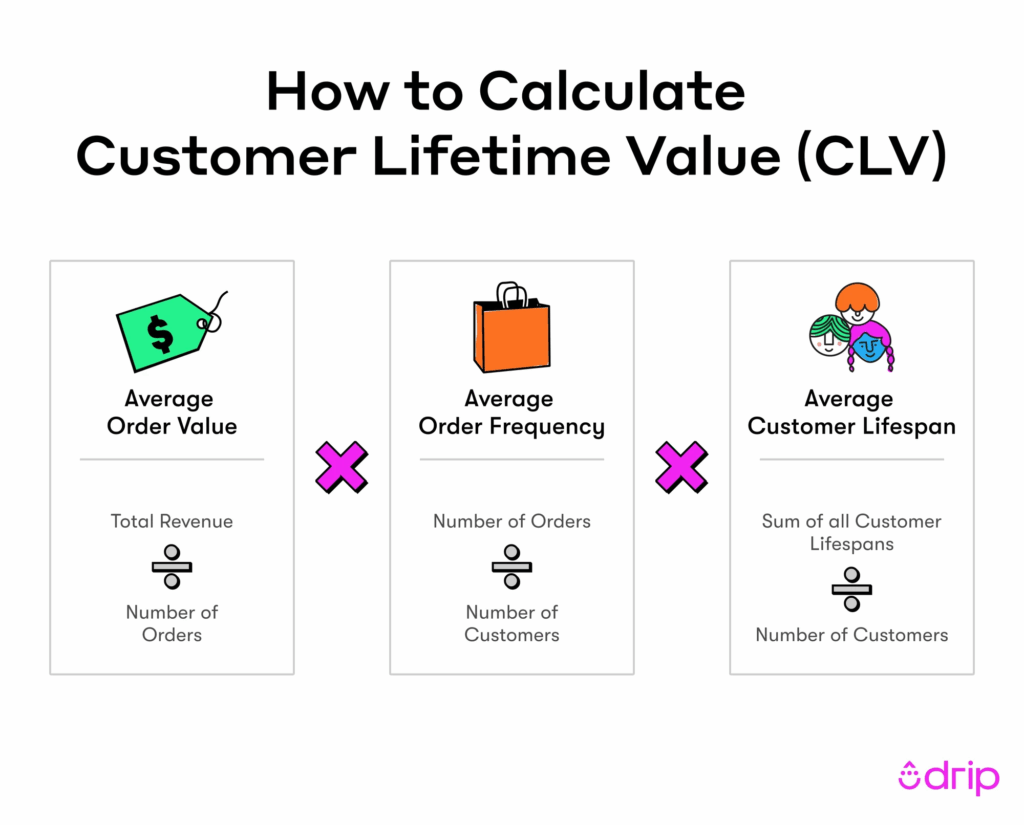
CLV depends on 3 variables which means you can control it by adjusting these four variables:
- Average order value
- Average order frequency
- Average customer lifespan.
If you have low LTV, work on increasing any one of these variables to increase it.
Cost per Click
Cost per click (CPC) refers to the cost paid by an advertiser or business for a single click on an ad. It is a marketing KPI used in an online advertising model where businesses run ads to generate traffic, leads, and sales.
Here’s how to calculate CPC for a campaign:
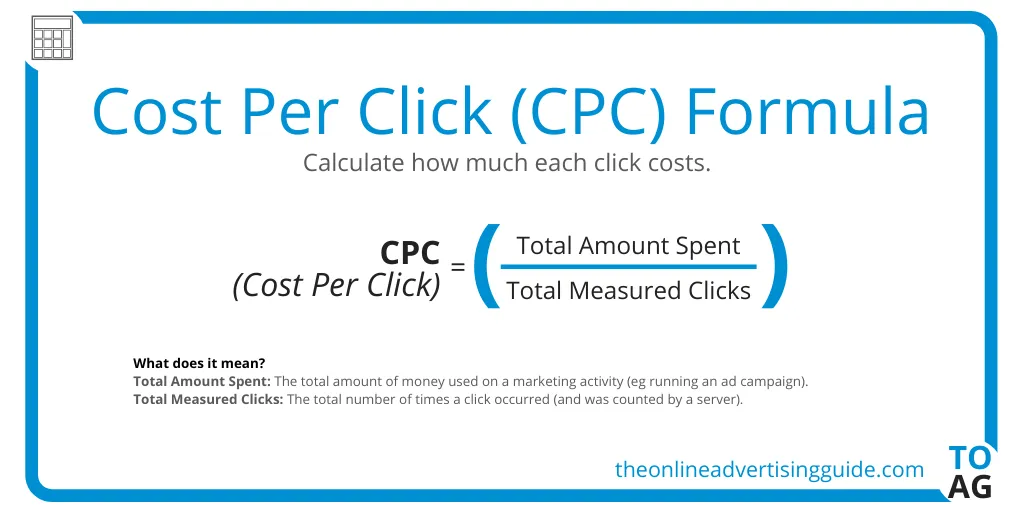
Almost all the ad networks, like Google Ads and Meta Ads, provide detailed reporting on CPC that helps you better understand advertising cost and ROI. It, however, doesn’t fully capture all the costs associated with sales generation. CPC is just a portion of the cost incurred to acquire a new customer and must be treated as such.
Cost Per Lead
Cost per lead (CPL) is the total cost you pay to acquire a lead. It is a more comprehensive online advertising KPI that measures the cost of a lead instead of cost per click.
Here’s how it is calculated:
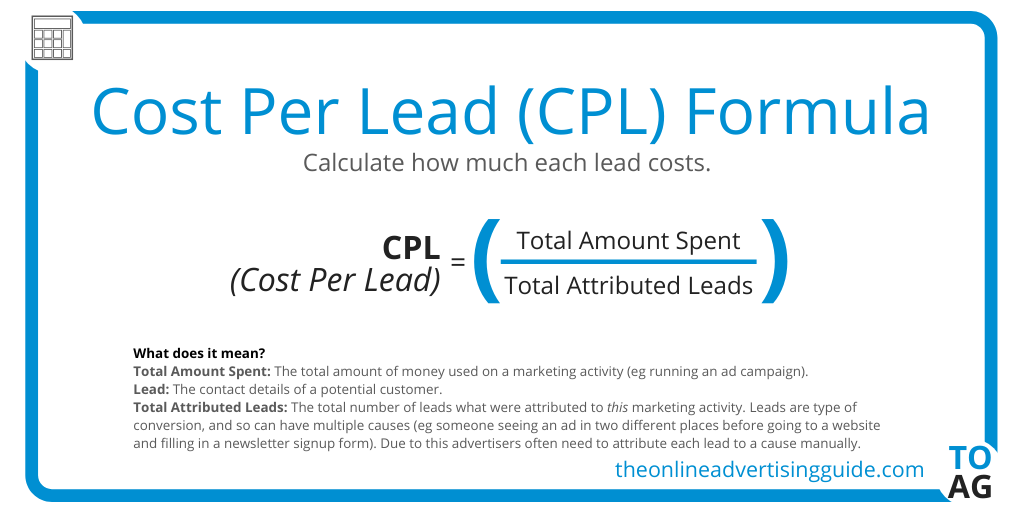
The total amount spent isn’t limited to the advertising or campaign budget, it should include all types of costs including:
- Salaries
- Software cost
- Advertising creatives.
It helps you identify the right advertising touchpoints that have the lowest CPL. It’s also useful in comparing different touchpoints.
Churn Rate
Churn rate or customer churn rate is the percentage of customers who leave your brand and stop doing business. It is the rate at which customers leave your business.
It is an essential marketing KPI for subscription-based businesses such as SaaS companies or any business that offers subscriptions. Churn rate is equally important for other types of businesses too, but it’s not as important as it is for subscription-based businesses.
It is calculated using the following formula:
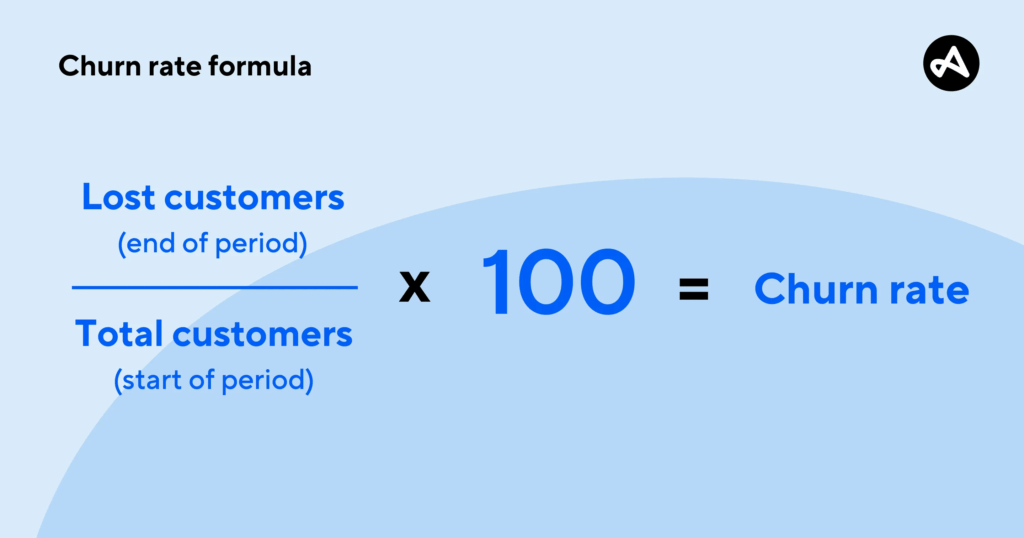
Customer churn rate is calculated for a specific period such as a month, quarter, or year. You need to take the total customers for a specific period and look at the customers churned during that period. It’s a variable KPI which means you might get different churn rates for different periods for the same business.
Ideally, the lower the churn rate, the better.
You can compare the customer churn rate with benchmarks for comparison.
Shopping Cart Abandonment Rate
Businesses that don’t have a subscription-based model track shopping cart abandonment rate instead of churn rate. It’s not the same but closely related.
Shopping cart abandonment rate refers to the percentage of people who add an item to a cart in your online store and leave your website without finalizing the purchase. It is an ecommerce marketing KPI that helps you track UX, lost sales, and barriers that restrict potential buyers from completing their purchases.
It is calculated as follows:
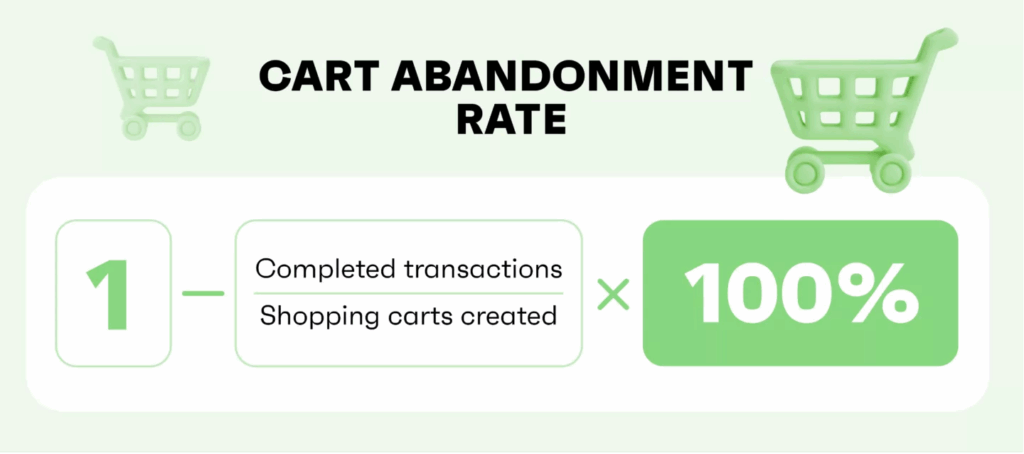
The average cart abandonment rate across industries is around 70%. If your store has a high rate, there’s something not right that needs to be addressed.
Cart abandonment rate doesn’t depend on one or a few variables, rather it depends on a lot of factors ranging from a slow website to a lack of trust badges to the absence of guest checkout features.
Return on Ad Spend
Return on ad spend (ROAS) is used in online advertising to measure revenue generated for every dollar spent on online ads. It specifically tracks the performance and the return of online ad campaigns. It is represented either in ratio or percentage.
Here’s how to calculate ROAS:

For instance, 200% ROAS means you make $2 in ad revenue from every $1 spent on ads. It is expressed as 2:1 in ratio form or can be expressed as 2x return.
It tracks revenue, not profit. This means while your ROAS might be positive (or extremely high), you might be in loss. A high ROAS doesn’t mean high profit.
This marketing KPI is reported by all the ad networks automatically for you. However, it must be used with caution as the reported ROAS only accounts for the ad spend, not the entire ad cost.
A logical step is to measure ROAS manually by adding all types of ad costs and not relying on reported ROAS.
Average Order Value
Average order value (AOV) is a marketing KPI that tracks the average dollar amount customers spend when they purchase from your website. It’s the size of the order in dollar value for every customer who shops from your online store.
It’s used by ecommerce stores to measure the size of orders over time.
It is calculated by using the following formula:

You need to measure it for a specific period (e.g., year or quarter) for better understanding and accuracy. It is an additional marketing KPI that you must use along with revenue to get insights into how your customers spend money with your business.
Marketing Qualified Lead
A marketing qualified lead (MQL) is a potential customer who interacted with your business up to a certain level and is now more likely to become a customer. MQL is a result of marketing efforts that persuade the target audience to take certain actions.
For instance, submitting a form on your website to get a quote and then responding to a marketing email.
Here’s the sequence of the lead funnel with MQL’s position right at the middle:

The actions that convert a lead into an MQL are defined by your business. Generally, leads are automatically moved from one stage to the next in the CRM based on defined rules.
MQL is a common marketing KPI that’s used by B2B businesses or B2C businesses with a long sales cycle.
Traffic Distribution
Traffic distribution refers to the classification of online traffic or site visitors into different channels and mediums. It’s a common distribution that’s automatically done for you by the analytics tool (e.g., Google Analytics).
Here’s an example of traffic distribution from Google Analytics:

The traffic distribution includes the following categories:
- Organic
- Paid
- Direct
- Referral
- Social.
This distribution helps you attribute traffic percentage to marketing spend. It plays a key role in marketing and optimization, as you can evaluate top sources of traffic.
Keyword Ranking
Keyword ranking is a marketing KPI used in inbound marketing to track your site’s ranking in SERPs for certain keywords. It helps you gauge organic traffic more accurately.
It’s used to track organic traffic performance by tracking keyword rankings.
You need to use apps like Ahrefs or Semrush for keyword ranking. Google doesn’t show exact rankings, but it shows average ranking in Search Console (which does a decent job).
Paid tools give you an exact ranking position per keyword in your desired location. Whereas Google Search Console shows the average ranking of a keyword.
In reality, rankings aren’t fixed. They fluctuate based on user behavior and preferences and several other factors.
If you need exact rankings, use a tool like Semrush.
If you prefer accuracy and don’t like to get an exact ranking position, use Search Console.
Share of Voice
Share of voice (SOV) is a marketing metric that measures brand awareness by tracking brand visibility. It compares your brand awareness on a specific marketing channel against your competitors.
It’s used mainly in online ads to measure the percentage of share your ads have on a specific channel. However, it can be used to track conversations, brand mentions, and even website traffic.
It is reported in percentage. A 25% SOV for brand mentions indicates 25% of all mentions on the platform are for your brand.
Here’s the formula to calculate SOV:
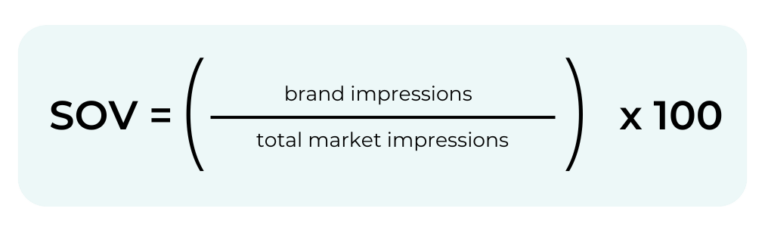
The impressions in the above formula can take any form such as conversations or ad views.
You can use tools like Hootsuite or Talkwalker that track SOV for you automatically. You need to integrate your CRM data with the tool to help it measure SOV accurately.
However, it’s challenging to track SOV accurately. It’s good enough to give you a nice idea of where you stand and that’s the purpose of this marketing KPI.
Backlinks
Backlinks are the external links pointing to your domain. The number of backlinks is the most important off-page SEO KPI that has a direct impact on rankings.
A backlink is considered a vote or endorsement that search engines use to determine the popularity of a website. The more backlinks you have, the higher the rankings:
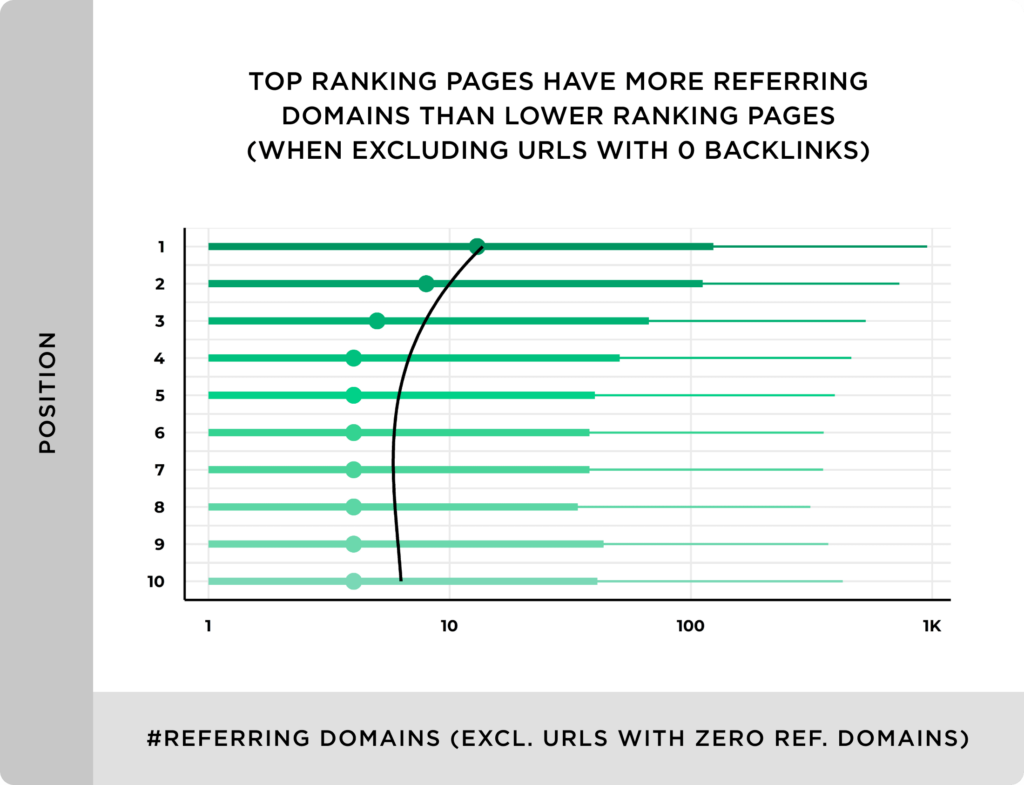
Backlinks help you track domain authority and search rankings with comparison to your competitors. Generally, backlinks are a measure of SEO.
When you are spending money on off-page SEO, the best way is to track the number of backlinks acquired during a specific time period. The outcome of a backlink isn’t instant and it’s not measurable. This is a reason why the number of backlinks is a more reliable marketing KPI for SEO.
You need to track backlinks using an SEO tool like Ahrefs or Semrush. Google Search Console also reports backlinks, but the interface isn’t user-friendly. If you have hundreds of backlinks that need to be managed, a paid platform works best.
Social Shares
Social shares is a social media marketing KPI that measures engagement in the form of social shares. It tracks shares across social media platforms generated by users that either redistribute or recommend your website or social content.
It is the sum of all the social shares your business has garnered during a specific period of time. Here’s how to calculate it:
Social shares = Shares on Facebook + Shares on Instagram + Shares on X
You can use the social platform’s analytics dashboard to track social shares, or you can use a third-party app like Hootsuite. Measuring this marketing KPI manually isn’t an option, unfortunately.
Social Media Engagement Rate
Social media engagement rate is a more holistic social media marketing KPI than social shares. It measures the interactions your social content receives during a specific period and on a specific platform.
It is reported in the form of a percentage and is reported by social networking sites. The formula for social media engagement rate is below:
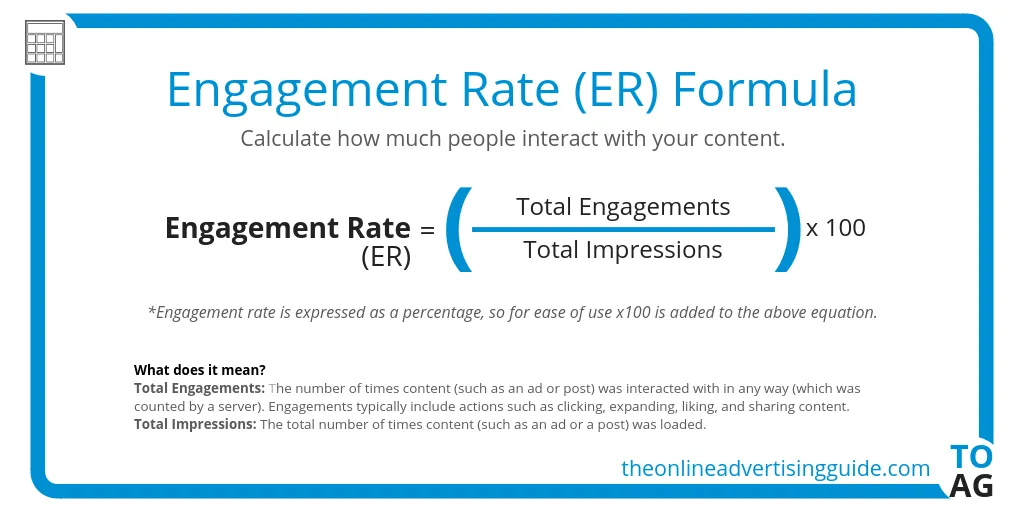
You can tweak this formula to measure engagement rate for a specific platform, or you can track it for your followers (by replacing total impressions with total reach for followers).
The engagement rate reported by social platforms by default uses different metrics. You need to make sure of what interactions they report. General interactions include likes, comments, shares, and clicks.
Follower Count
Follower count refers to the total number of people who have subscribed to a social profile or account. It measures account size and its reach.
Brands use follower count to track their popularity and influence. It is also used to compare brands based on their reach across social networking sites.
The number of followers doesn’t require tracking as its reporting by social platforms by default.
Email Open Rate
Email open rate is an email marketing KPI that refers to the percentage of delivered emails opened by your subscribers. It is an engagement KPI that is reported as a percentage.
It is calculated using the following formula:

Open rate is reported by your email marketing platform by default. You don’t have to calculate it manually. And there’s no way you can calculate it manually, as emails delivered and opened are exclusively tracked by the email marketing tool you are using.
The general benchmark across all industries is 30% for email opens. If you are doing lower, you need to work on it by improving the subject line, preheader text, and other relevant variables that impact email open rate.
Email Unsubscribe Rate
Email unsubscribe rate is the percentage of subscribers who opt out of your list after an email campaign.
The unsub rate depends on the campaign and might vary from campaign to campaign.
Here’s how it is calculated:
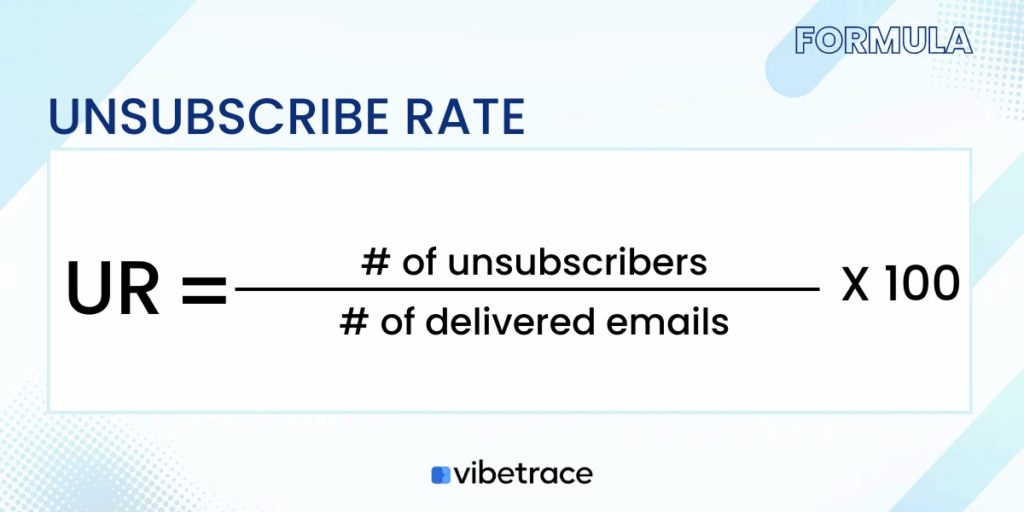
It measures email engagement, which is based on a wide range of variables. The unsub rate is reported by the email marketing app you are using. You don’t have to calculate it manually.
Generally, an unsub rate of 0.5% or lower is ideal. Anything above 0.5% means something isn’t right.
Final Words
Marketing KPIs are a perfect way to measure marketing performance.
There are hundreds of KPIs out there and it often gets overwhelming for businesses.
You need to pick and choose the best and most relevant marketing KPIs for your brand. There’s no need to track every one of them.
It’s better to track a few KPIs and understand them properly than to track over 100 KPIs and take no action whatsoever.
You get insights via KPIs that must be used for optimization. Make sure you don’t waste resources on tracking useless marketing KPIs or useful ones that you don’t use in any way.
Featured Image: Unsplash